Business Intelligence
A simple way to make complex analyses – use modern systems to report and visualize your data.
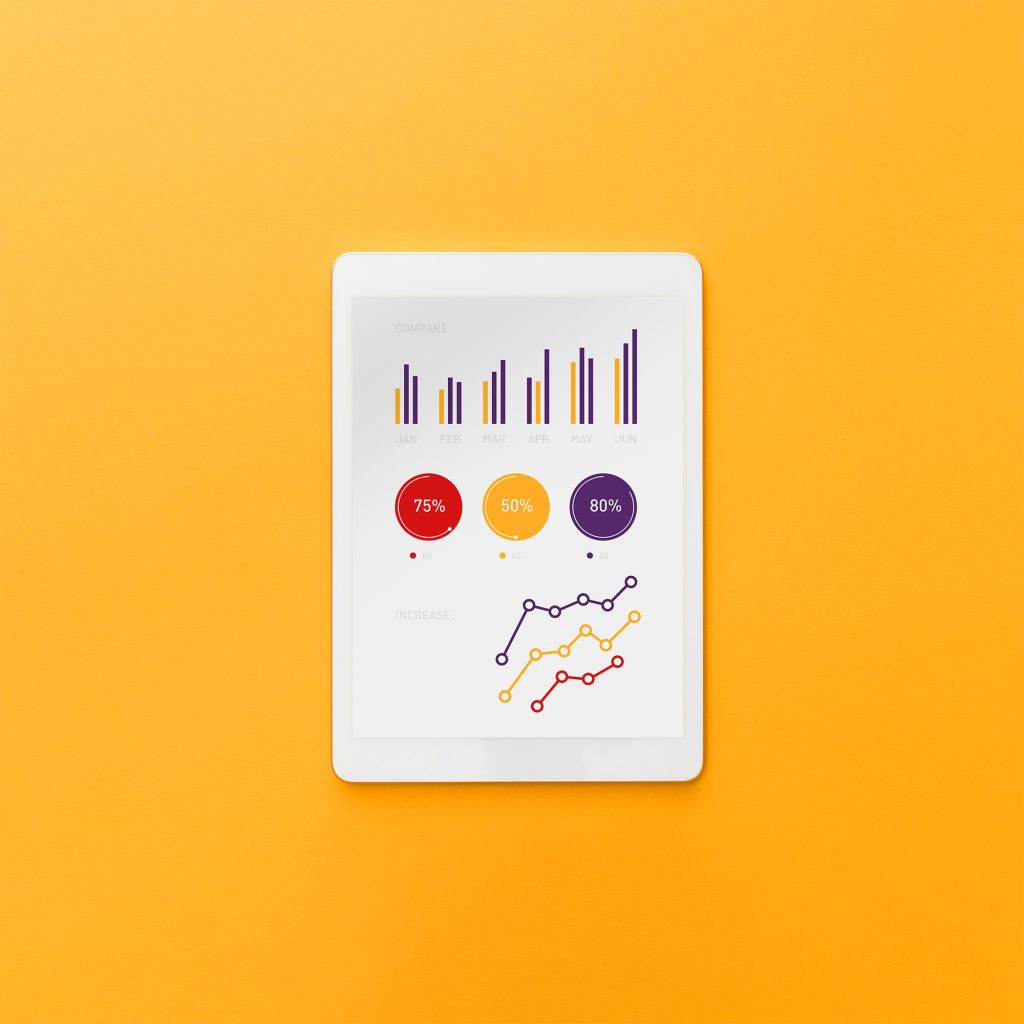
With dedicated, custom dashboards, we can turn Business intelligence tools into visual analytical dashboards that are easy to read and streamline all required data and insights.
Unlimited data visualization capabilities
The variety of reports, tables, and charts available allows you to tailor the presentation of your data to individual needs and expectations.
Multidimensional analysis
Analyze data from multiple perspectives and easily deepen your analysis as you move on to the next levels of detail.
Ready-made dashboards and reports
Create custom dashboards and reports to instantly gain insights in any area, from user engagement and conversions to process and financial health. Share with others, add additional analysis and more, as needed.
Mobility
Enjoy access to reports and analytics platforms from anywhere, and on any device. Both in-app or in-browser.
Manage access and roles
Grant permissions and manage access for different groups of users. Increase the use of data by the right people across your organization, without multiple datasets or duplicate reporting.
Data security
Monitor and secure data, control access to reports, data, and analytics by managing user permissions in your organization.
Make informed decisions based on your data with Business Intelligence
Business Intelligence (BI) tools enable you to create user-friendly dashboards, as well as reports, tables, charts and other interactive forms of data visualization. They allow the integration, processing and transformation of huge data sets from a variety of sources into valuable information.
The right business analysis tools provide real-time insights into your data. Clear and easy-to-understand visualizations ensure faster and more informed decision-making. Our BI tools enable companies to identify trends, opportunities and challenges. Advanced analytics provide a deeper understanding of your customers and optimize operations such as budgeting, planning, sales and cost accounting.
With customizable reports, interactive elements and real-time updates, data presentation becomes child's play, improving communication and understanding within the organization. Consequently, the use of BI and data visualization tools enables more effective management of your business at both the strategic and operational levels.
Let's talk about rolling out BI in your company!
Explore other solutions
/ Data Analytics & Machine Learning
-
Predictive analysis
Predictive analysis, based on historical data, will enable you to detect repetitive patterns, thanks to which you will better understand customer behaviour and effectively predict future events. Automate the decision-making process at the operational level and increase the efficiency of activities.
-
Dynamic pricing & analysis
Adjust the level of prices and discounts for products to individual customer segments. This will improve your competitiveness and optimize the level of sales and margins.
-
Recommendation Engines
Create a personalized product offer. Increase the value of your shopping cart and create a better shopping experience for your customers to guarantee their loyalty.
-
Sales & demand forecasts
Make predictions that mirror actual demand, thus avoiding shortages in the warehouse and fully satisfying market needs.
-
Intelligent OCR
We can create a tool that automatically recognizes and digitizes documents, based on photos – intelligent OCR tools based on neural networks.
-
Customer Intelligence
Thanks to a better understanding of customers at every stage of their purchasing path, you will better adapt your offer to their needs and engage in more effective marketing and sales activities. Reach sales and margins growth based on customer behaviour analysis.
Goals Achieved
/ with Business Intelligence


Automating Seasonal Analytics for a Premium Fashion Brand
Streamlining analytical processes thanks to Power BI.


Reliable and Scalable Reporting Environment for Production in the Construction Industry
For the market leader in steel pipe culverts and structural elements, we have modernized the reporting environment in Power BI.
The Technologies
/ Behind Solution
Our Experts
/ Knowledge Shared

B2B Platform Implementation / Where to Start
In a world where the pace of change accelerates with each year, digitization of B2B sales is no longer a choice – it’s a necessity. Companies that want not only to stay afloat but also to spread their wings are increasingly reaching for modern B2B platforms. These platforms allow for streamlining processes, automating key operations, and...

Shopware vs. Magento – Which E-commerce Platform is Right for Mid-Sized and Large Projects?
Choosing the right e-commerce technology is one of the most strategic decisions when planning and scaling an online store. The right platform can not only drive sales but also accelerate time-to-market, reduce operational costs, and streamline business growth. In this article, we compare two popular yet fundamentally different platforms: Magento (Open...

What will the furniture industry be like in 2025?
Stable Growth of E-Commerce in the Furniture Industry The year 2024 was not the easiest for the furniture industry, with media reports highlighting the challenges faced by many companies in this sector. However, in terms of e-commerce, the past year can be considered successful. In November, sales in the “furniture, RTV, and home appliances”...
