Models for Efficient Implementation of Power BI
A dynamically developing system
Power BI is currently one of the most popular self-service Business Intelligence systems. One source of its popularity is very intensive development. Every month, a new list of functions appears. Microsoft releases more functionalities of the product.
You can read about them on the blog of the service: Members can learn directly about the updates on the Power BI blog.
New functions are frequently added at the explicit request of users. Everyone can vote on ideas they and others submit.
The basic model of Power BI is based on two main components, a desktop application and a cloud service. Users of the desktop application can download a new version and install it once a month on their own devices. In addition, Microsoft updates the cloud service following a similar cycle. This model gives the supplier the greatest possibilities for developing the system and adding new functions to it.
Data Import
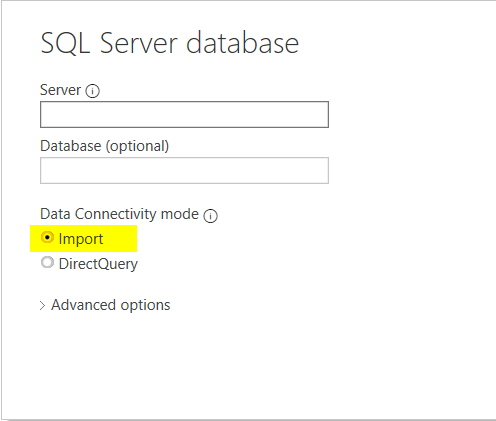
Implementation of Power BI in the basic model comes down to importing data from source systems to the Power BI Desktop file (for individual work with the data or reports construction) or to the cloud services through a data gateway tool. Read more about it on the producer’s website.

In such cases, a copy of all source data files is stored in our PBIX file or in the cloud. Import is performed on user demand or according to a defined schedule (this applies only to the Power BI service). The data is stored in structures optimized for creating reports and they are processed in the computer’s operational memory, which means the report generation time is very short. Furthermore, users reviewing the reports do not burden the systems from which the data originated. This model also provides full flexibility in creating your own columns and measures using the capabilities offered by DAX.
Direct Query
However, there are cases in which the basic implementation model may not meet our requirements. This can happen when:
1. The volume of the analyzed data exceeds the limit of a single data set, which in the case of the Power BI Pro License is 1 GB, and for Power BI Premium 10 GB. It should also be added here that data imported into the Power BI Desktop application, which in the cloud translates into the size of the dataset, is compressed by a ratio of about 10:1. A 100 MB file after loading into Power BI should therefore occupy about 10 MB.
2. We need to have access to live data. Importing data from the source system to the cloud always takes some time. If we need to keep track of current data (temperature, currency exchange or stock rates, inventory, or any other data) then import may introduce an additional and undesirable delay in accessing this data.
3. For some reason (e.g. legal) we do not want or cannot copy the data and send it to the cloud.
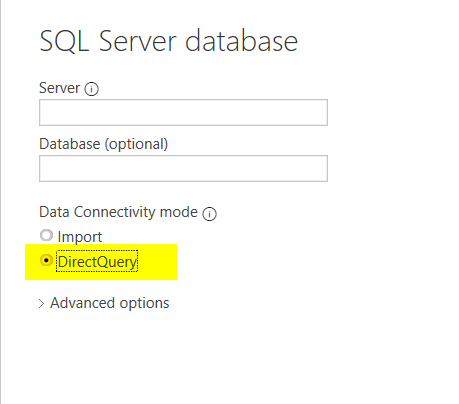
In that case, we can use the Direct Query option when connecting to the source.
This option means the data remains in the source system and each display of the report will generate a query to the source database and will transfer the result to Power BI.

When working with this type of connection, building reports in the context of performance requires a careful approach. If the reports page contains a lot of visual elements, each of them will generate a request to our local database. This can put a significant strain on our systems and cause performance problems.
The number of sources that we can connect to in this model is also smaller than in the case of the traditional data import model. Supported data sources are listed here.
It’s worth adding that in the direct query model the DAX language capabilities are limited. For example, features from the Time Intelligence group, which offer a lot of interesting opportunities associated with year-on-year/month-to-month generating comparisons, will not work. These functions do not have counterparts in the SQL language, hence their lack of a direct connection to the database.
Importantly, we can build a hybrid data model that imports data from some sources and connects directly to another part. In this way, we can try to bypass the limitations of both of the presented models.
Live Connection
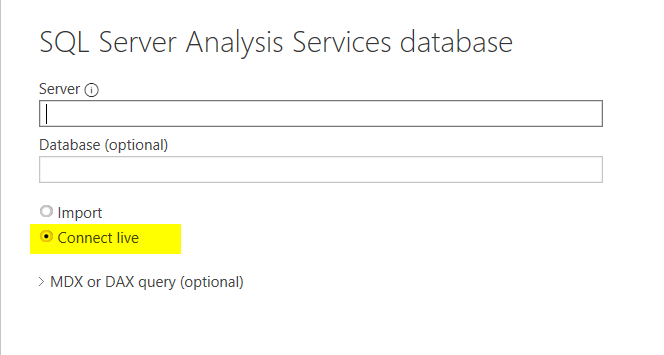
Power BI uses a data storage and aggregation engine from the OLAP server solution, which is Analysis Services. Therefore, if these systems are twins, then you can build a solution in which Power BI will work only as the user interface, while the data will be stored and processed on the server. A live connection is therefore only available for the Analysis Services data source. By connecting with this source we can import the whole model to Power BI, but the live connection will give us the following effects:
• Bypassing potential dataset size limits (here, the size and performance of our own infrastructure limits us).
• We can decide where the data is stored. It can be in our data centre or in the cloud via the Azure Analysis Services service.
• We query the structure prepared for reporting – the risk of performance problems is definitely lower than in the case of Direct Query.
• On the server side, we can exploit the full capabilities of the DAX language.

In this model, we lose the PowerBI self-service expressed in the possibility of its users developing the data model. If the data is stored in Analysis Services, management of development of data models must be the central concern. Importantly, we can’t build a hybrid model where a portion of the data could be stored in PowerBI and the rest in the Analysis Services. These models simply cannot be combined.
The report server
Power BI also exists in the form of a report server that can be run in a local environment. This is not exactly the same solution as traditional Power BI, although it comes from the same concept. The report server is available with the Power BI Premium license and is also part of the Enterprise edition of MS SQL Server.
If we want to use a local report server, we must download a version of the Power BI Desktop application adapted to it. More information on this topic here.
We will be able to publish reports on a server located in our data center via this application.
For natural reasons, this Power BI model cannot grow as quickly as the cloud edition. It is assumed that the new version of the server report comes out once every four months. New features and fixes are first added to the Power BI service. There are also functions that are intended for the Power BI cloud service and that will never appear in the report server.
A detailed comparison of the functions of both solutions can be found here.
Summary
Power BI is one of the most popular Self Service Business Intelligence class systems. Its most effective operating model is a combination of a desktop application and a cloud service. However, this model has some limitations that can be bypassed using the mechanisms described in this article.


